GDB에서 코드 실행 시간을 체크해보자.
목차
GDB Time Checker
GDB 사용 도중 중단점과 중단점 사이의 시간을 체크해보고 싶었다.
GDB의 내장 파이썬을 사용해 진행하였다. (따라서 GDB가 파이썬을 지원하지 않는다면 필자가 서술하는 방법은 사용할 수 없다.)
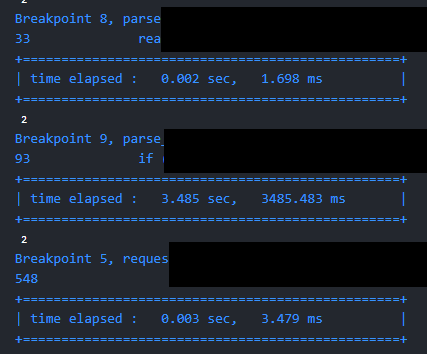
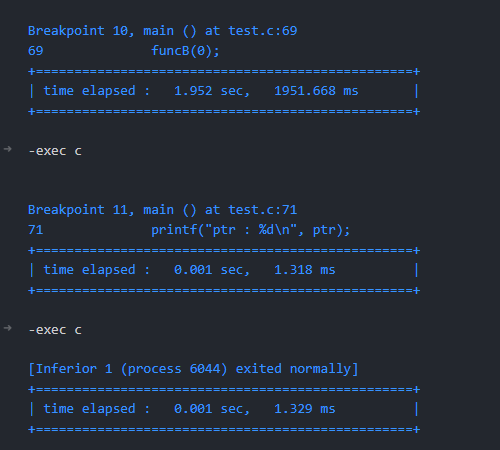
최종 결과물은 다음과 같이 보여졌다.
확실히 어디 중단점 간의 시간이 가장 많이 걸렸는지 체크할 수 있었다.
우선 홈 디렉토리에 .gdbinit 파일을 생성한다
1

touch ~/.gdbinit
필자는 걸린 시간을 좀 더 깔끔하게 표시하고 싶어 TrueType 폰트 기준 깔끔하게 표시해주는 함수를 하나 생성하였다. 아래 코드는 첫 번째 결과값의 사진처럼 내용물을 사각형으로 표시하기 위해 공백 및 파이프라인 ( | ) 문자를 추가해주는 함수이다.
1
2
3
4
5
6
7
8
9
10
11
12
13
14
15
16

# SET TIMEIT FUNCTION =================================================
python import time
python line_str = "+=================================================+"
python line_str_len = len(line_str) - 1
python
def set_ti_line(ti_str, ed_len):
    ti_str_len = len(ti_str)

    for i in range(ti_str_len, ed_len):
        ti_str += ' '

    if (ti_str_len < ed_len):
        ti_str += '|'

    return ti_str
end
이후 continue 전후로 실행 결과를 출력하는 define을 정의한다.
필자는 ‘c’로 설정하였다.
GDB의 continue의 약자가 c이기 때문에 해당 define을 설정하면 c 입력 시 continue가 동작되는 것이 아닌 define된 값이 동작하게 된다.
이것 이 싫다면 define value를 변경해주면 된다.
1
2
3
4
5
6
7
8
9
10
11
12
13
14
15
16
17
18
19
20
21
22
23
24
25
26
27
28
29
30
31
32

# define chktime
define c
    python import time

    python start_time = 0
    python end_time = 0
    # python st = time.perf_counter()
    python start_time = time.time()
    continue
    python end_time = time.time()
    # python ed = time.perf_counter()
    # python print(f"time elapsed : {int(round((ed - st) * 1000))}ms")

    python dur_time = end_time - start_time
    python time_str = "| time elapsed :   {:.3f} sec,   {:.3f} ms".format(dur_time, (dur_time * 1000))
    python time_str = set_ti_line(time_str, line_str_len)
    python print(line_str)
    python print(time_str)
    python print(line_str)
    python print("")
end

document c
    Time execution of next function
    Usage: c
end

# document chktime
#     Time execution of next function
#     Usage: chktime
# end
# =====================================================================
설정 후 저장한다.
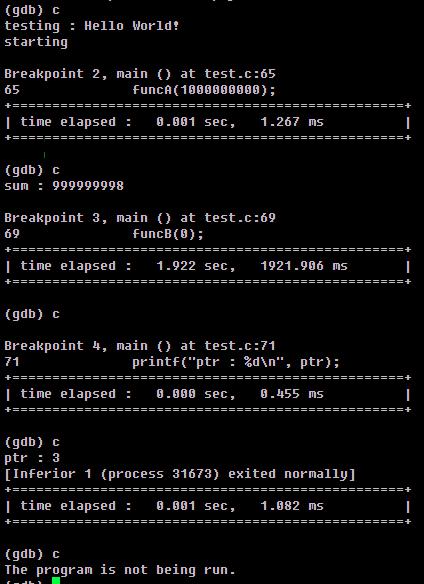
이후 gdb를 돌려 C 명령을 실행해보면 중단점 사이의 실행 시간을 획득할 수 있다.
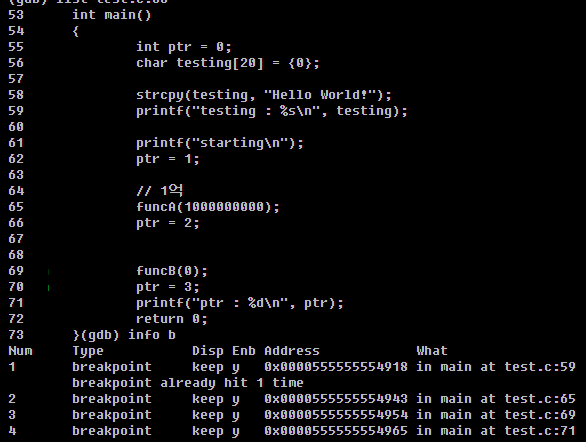
아래와 같이 중단점을 4개 지정하였다.
중단점 별로 실행 시간이 출력된느 것을 확인할 수 있다.
.gdbinit 추가된 내용 정리
1
2
3
4
5
6
7
8
9
10
11
12
13
14
15
16
17
18
19
20
21
22
23
24
25
26
27
28
29
30
31
32
33
34
35
36
37
38
39
40
41
42
43
44
45

# .gdbinit 추가된 내용 정리

# SET TIMEIT FUNCTION =================================================
python import time
python line_str = "+=================================================+"
python line_str_len = len(line_str) - 1
python
def set_ti_line(ti_str, ed_len):
    ti_str_len = len(ti_str)

    for i in range(ti_str_len, ed_len):
        ti_str += ' '

    if (ti_str_len < ed_len):
        ti_str += '|'

    return ti_str
end

define c
    python import time

    python start_time = 0
    python end_time = 0
    # python st = time.perf_counter()
    python start_time = time.time()
    continue
    python end_time = time.time()
    # python ed = time.perf_counter()
    # python print(f"time elapsed : {int(round((ed - st) * 1000))}ms")

    python dur_time = end_time - start_time
    python time_str = "| time elapsed :   {:.3f} sec,   {:.3f} ms".format(dur_time, (dur_time * 1000))
    python time_str = set_ti_line(time_str, line_str_len)
    python print(line_str)
    python print(time_str)
    python print(line_str)
    python print("")
end

document c
    Time execution of next function
    Usage: c
end
# =====================================================================
해당 command를 VS Code로?
필자는 콘솔 GDB보다 주로 VS Code의 C/C++ 확장을 이용해 디버깅을 하는 관계로
해당 명령어를 VSCode에서도 사용하고 싶어졌다.
필자는 VS Code 확장을 만드는 능력은 없으므로 편법을 통하여 VS Code 디버그 콘솔에서 Continue하는 명령을 손수 지정하면 될 것 같았다.
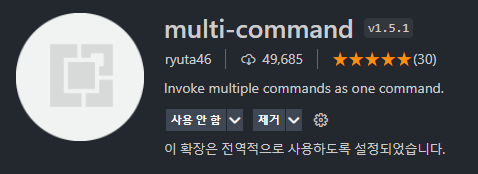
아래 확장을 설치한다. (multi-command) macros 등 multi-command 를 지원하는 확장이라면 OK
settings.json을 열고 multi-commands 확장을 이용해 커스텀 명령어를 작성한다.
1
2
3
4
5
6
7
8
9
10
11
12
13
14
15
16
17
18
19
20
21
22

"multiCommand.commands": [
		{
		    "command": "multiCommand.continue_custom",
		    "sequence": [
		        "workbench.debug.action.focusRepl",
		        // "workbench.debug.action.toggleRepl",
						// snippet으로 명령을 삽입하기 전 기존 작성된 내용이 있다면 지운다.
		        "editor.action.deleteLines",
		        {
		            "command": "editor.action.insertSnippet",
		            "args": {
						// -exec가 들어가는 이유는
						// C/C++ 확장에서 GDB 명령어를 직접 사용할 시
						// 앞에 -exec를 붙여줘야 한다.
						// define 이름을 다르게 설정했을 경우 바꿔줘야 함
		                "snippet": "-exec c"
		            }
		        },
		        "repl.action.acceptInput"
		    ]
		},
]
이제 multiCommand.continue_custom 명령을 실행하게 되면 .gdbinit 에 적용시켰던 c define이 실행될 것이다.
아, keybindings.json을 열어 커스텀한 명령을 키바인딩 해주는 것도 잊지 않았다.
디버그 상태이며 중단점에 걸려있을 경우에만 alt + f1 키가 동작하도록 설정.
1
2
3
4
5

{
    "key": "alt+f1",
    "command": "multiCommand.continue_custom",
    "when": "debugState == 'stopped'"
},
alt + f1키를 눌렀을 때 gdb 콘솔창에서 duration time이 제대로 찍힌 것을 확인할 수 있었다.
번외
GDB define 작성 도중 특정 명령어 전/후로 명령어를 실행시킬 수 있는
hook, hookpost 명령이 존재하는 것을 새롭게 알게 되었다.
hook, hookpost 기능을 사용해 이렇게 명령어를 작성해서 시간을 체크해보려고 했다.
hook-continue로 continue 하기 전 start_time을 체크하고 hookpost-continue로 continue한 후 end_time을 체크해 걸린 시간을 파악하는 방식
1
2
3
4
5
6
7
8
9
10
11
12
13
14
15
16
17

# hook cannot check duration time. Async processing
define hook-continue
    python start_time = 0
    python end_time = 0
    python start_time = time.time()
end

define hookpost-continue
    python end_time = time.time()
    python dur_time = end_time - start_time
    python time_str = "| time elapsed :   {:.3f} sec,   {:.3f} ms".format(dur_time, (dur_time * 1000))
    python time_str = set_ti_line(time_str, line_str_len)
    python print(line_str)
    python print(time_str)
    python print(line_str)
    python print("")
end
그러나 아쉽게도 해당 명령어로는 제대로 된 시간 파악이 불가능하였다.
이유인즉슨 hook-continue로 continue 하기 전 start_time을 체크하는 것 까지는 좋았으나
hookpost 실행 시점이 continue 명령이 실행되어 다음 중단점에 걸려지고난 뒤 동작하는 것이 아니라 continue 명령이 실행되지마자 hookpost가 실행되는 방식이었다.
따라서 해당 방법으로는 다음 중단점까지의 실행 시간을 획득할 수 없었다.